
What is BCG Matrix? How to Use BCG Matrix to Evaluate Costs and Benefits
Most business models today are based on a product or service line that is currently profitable. However, history has shown us that the organizations that don’t embrace change are doomed. Nothing can reinforce this fact more than the data that out of Fortune 500 firms in 1955, Only 60 Fortune still remain.
The need to come up with a strategy of providing products or services that are profitable now, but will remain profitable and don’t burn cash is very important.
While it is easier to evaluate the current cash-generating business units, businesses must focus on the future, and accordingly change their product, service or investment portfolio to remain profitable and relevant in the ever-changing market environment.
Identifying which products, services and investments should be continued and with what level of investment is a complicated yet extremely important task. During the days when the complexity perhaps was much lesser, the Boston Consulting Group model (developed by Bruce Henderson) provided a simple solution for managing your portfolio of products.
In the 1970s, the Boston Consulting Group matrix also known as Growth-Share matrix was developed as a method for assessing the value of the investments in a company’s portfolio. The four-field matrix distinguishes between four different types of investment and provides a solution about what to do about the product, service or investment featuring in each of the quadrants.
Understanding the BCG Matrix
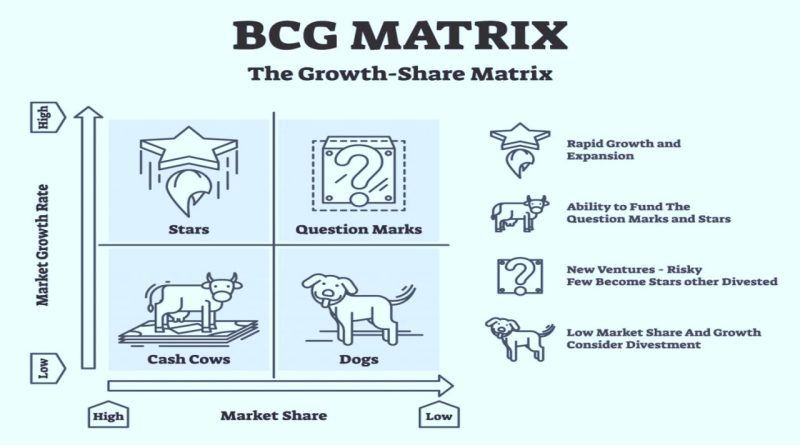
BCG Matrix is a 4 quadrant model where the x-axis is the market share or relative market share of your product, service or investment and the y-axis is the market growth rate. You can see the BCG Matrix diagram below to visualize the model.
Understanding the dimensions of Relative Market Share and Market Growth rate in the BCG Matrix
Relative market share
One of the dimensions used to evaluate business portfolio is relative market share. A high market share for a business ‘usually’ results in higher cash returns. The business with high market share has economies of scale, higher experience curve and an established position in the market which yields higher profits.
However, it is important to note that some businesses may have the same benefits with lower production outputs and lower market share. These are usually extra-luxury and high-end products. As there may not be many competitors in this market, the relative market share is usually calculated with respect to the market leaders in the entire product or business unit.
For example Leica Cameras. They are expensive and have less market share but still sell significant units. It should not be compared with ultra-expensive camera units that are produced in hundreds but cost a ton. The relative market share should still ideally be calculated based in comparison with profession cameras.
Market growth rate
High market growth rate means higher earnings and sometimes profits but it also consumes lots of cash, which is used as an investment to stimulate further growth. Therefore, business units that operate in rapid growth industries are cash users and are worth investing in only when they are expected to grow or maintain market share in the future.
Creating BCG Matrix of your business portfolio
BCG Matrix is a simple tool and you basically need accurate calculations on the market share and growth rate of your products, service or investment. While it is easier to assess market growth, what is important is to objectively derive at the market share data.
This is essentially done by comparing yourself to the largest competitor and think in terms of growth over the next three years. In an extremely fragmented market, however, you can use absolute market share instead of relative market share.
Next, you can either draw a matrix as depicted in the diagram below. You can find the pdf template of the BCG Matrix and download below.
In this four-quadrant chart, market share is shown on the horizontal line or the x-axis and growth rate along the vertical line or the y-axis. The four quadrants are designated Stars (upper left), Question Marks (upper right), Cash Cows (lower left) and Dogs (lower right).
The model uses a matrix, each box representing a type of product: The placement for a type of product, service or investment defines how will you address them. By looking at the matrix, it is easy to see why each category has certain characteristics and prospects. Below are the explanations of each category.
1. Cash cows
Cash cows have a high market share but a low growth rate. Which actually means they don’t cost much but promise high returns. A good example of a cash cow is Google’s online advertising business. They have a high market share in a saturated market and don’t need to spend a lot to get high returns from the business.
Every business portfolio wants to maximize cash cows and is the eventual aim of all business units.
Consultants’ verdict: milk them.
2. Stars
Stars have a high market share and a high growth rate. They can generate some profit, however, growth is at the expense of money and these are cash consuming. The hope is that eventually the stars will be transformed into cash cows.
Android business for google is a Star. They have a very high market share in a high growth market but it is consuming money.
Consultants’ verdict: invest.
3. Question marks
Question marks are the ‘problem child’, they have high growth potential but a low market share. With a lot of (financial) support and strategic, they can be turned into stars.
Google plus business for Google in Social Media space was a question mark. However, it is another matter they couldn’t turn it into a Star and eventually had to shelve it.
This, however, makes the question marks a difficult decision to make. It can go either way, it can move to be a Star or it can move into a Dog.
Consultants’ verdict: a difficult decision and must be evaluated
4. Dogs
These are business units with a low share in a saturated market. Dogs should be held on to only if they have a value other than a financial one (e.g. a vanity project or favor for a friend).
Online blogging platform Blogger for Google can be an example of Dogs. It is operating in a, now obsolete user-generated blogging space but still has a much lower market share. Whether Google is going to liquidate the business is to be seen.
Consultants’ verdict: liquidate.
How to use the BCG Matrix Tool?
The application of BCG analysis involves 6 steps mentioned below:
1. Identify the unit to be analyzed
BCG matrix can be used to analyze SBUs, separate brands, products or a firm as a unit itself. The choice of unit selected for analysis is the foundation of the entire exercise. Therefore, it is essential to correctly identify the unit for which you’ll do the analysis.
2. Define your market
Defining the market is one of the most important steps in the analysis. This is because an incorrectly defined market may lead to poor classification.
For example, in an analysis for the Daimler’s Mercedes-Benz car brand in the passenger vehicle market, it would end up as a dog as it holds less than 20% relative market share. However, if you chose the correct market as luxury car market it would place it as a cash cow.
The definition of the correct market is critical to understand the firm’s portfolio position and should be done after proper assessment.
3. Calculate the relative market share
Relative market share can be calculated in terms of either revenue or market share. This is calculating by diving your unit’s market share by the market share of the industry leader.
For example, if your competitor’s market share in the motorbike industry was 45% and your firm’s brand market share was 9% in the last year, your relative market share would be only 0.2. Relative market share is plotted on the x-axis.
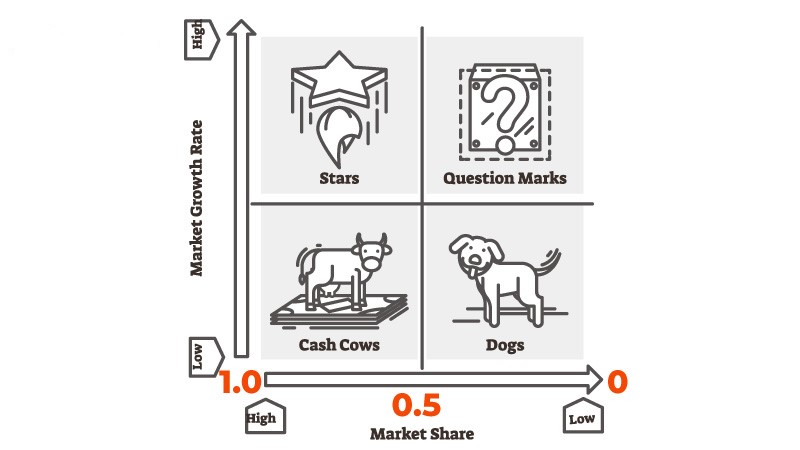
It’s top left corner is set at 1, midpoint at 0.5 and top right corner at 0 (see the example below for this).
The formula to calculate relative market share:
Relative market share = Company’s market share or revenue /Largest competitor’s market share or revenue
4. Identify the market growth rate
The industry growth rate can be found through various second-hand information, these are usually easily accessible online. It can also be calculated by looking at average revenue growth of the leading industry firms. The market growth rate is measured in percentage terms.
The scale of the y-axis, i.e the market growth rate varies depending on the industry. Normal practice is to set the midpoint of the y-axis at 10%. This gives the maximum growth rate as 20%, while it may work for many industries but some industries grow faster or slower than that.
Therefore, when doing the analysis you should find out what growth rate is seen as significant (midpoint) to separate cash cows from stars and question marks from dogs.
5. Map the circles on a matrix
After setting up the x and y-axis, you should be able to plot your units on the matrix. You should do this by drawing a circle for each brand. The size of the circle should correspond to the proportion of business revenue generated by that brand.
A final plotting of BCG Matrix for Google may look like this.
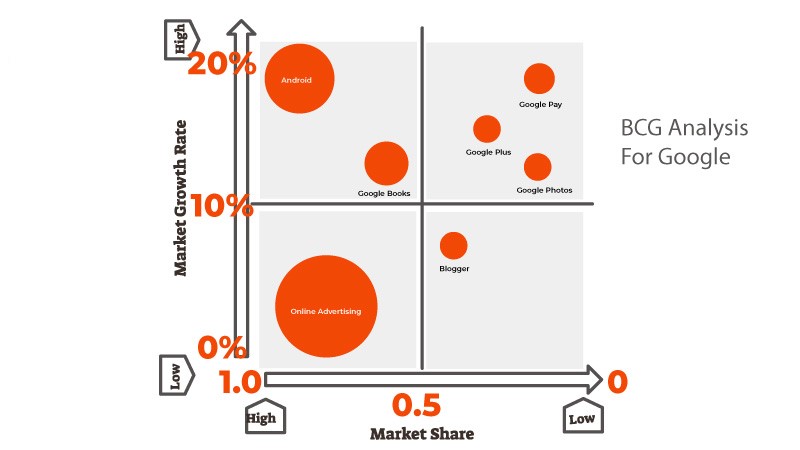
This is a simple example of a BCG Matrix application for google. You can practice doing it for companies that are well known, like Samsung, Nestle, ITC, Coca-Cola, Apple, etc. to better your skills and practice as the information is widely available in public domain
6. Analyze and take action based on the quadrant
BCG matrix quadrants are simplified versions of your market realities. It should be used in conjunction with other business analysis and decision making tools to maximize its effectiveness.
It normally provides general investment guidelines but does not replace strategic thinking. A business can use leadership judgment, SWOT Analysis, Force field analysis, and PEST analysis to make a precise and sound business decision.
 |
| Limitations of the BCG Model
– The BCG Model is often seen as very simplistic Nevertheless, the BCG matrix is a simple yet very useful decision-making tool and is widely used even today in a very dynamic and technologically driven business environment. |